Grid Shift — Fabric App
Views: Overview · Monthly
The app
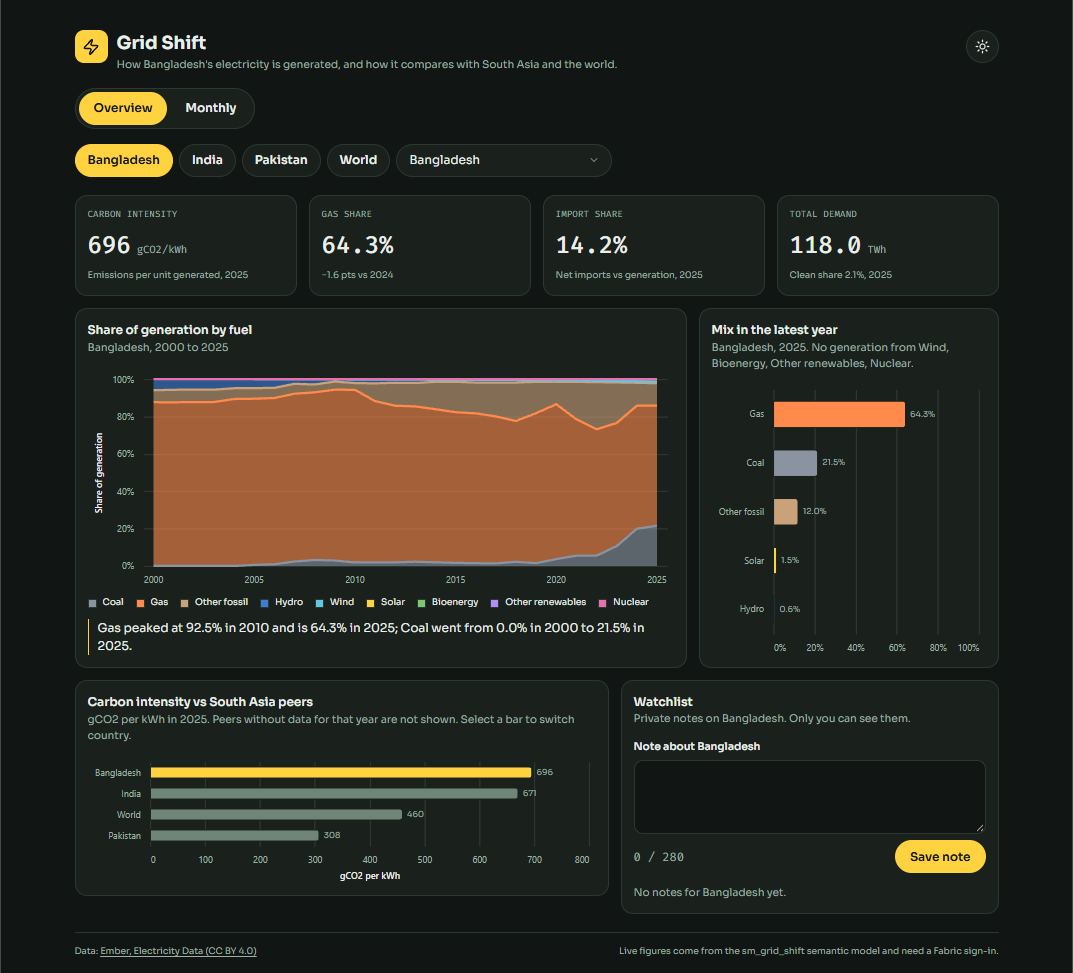
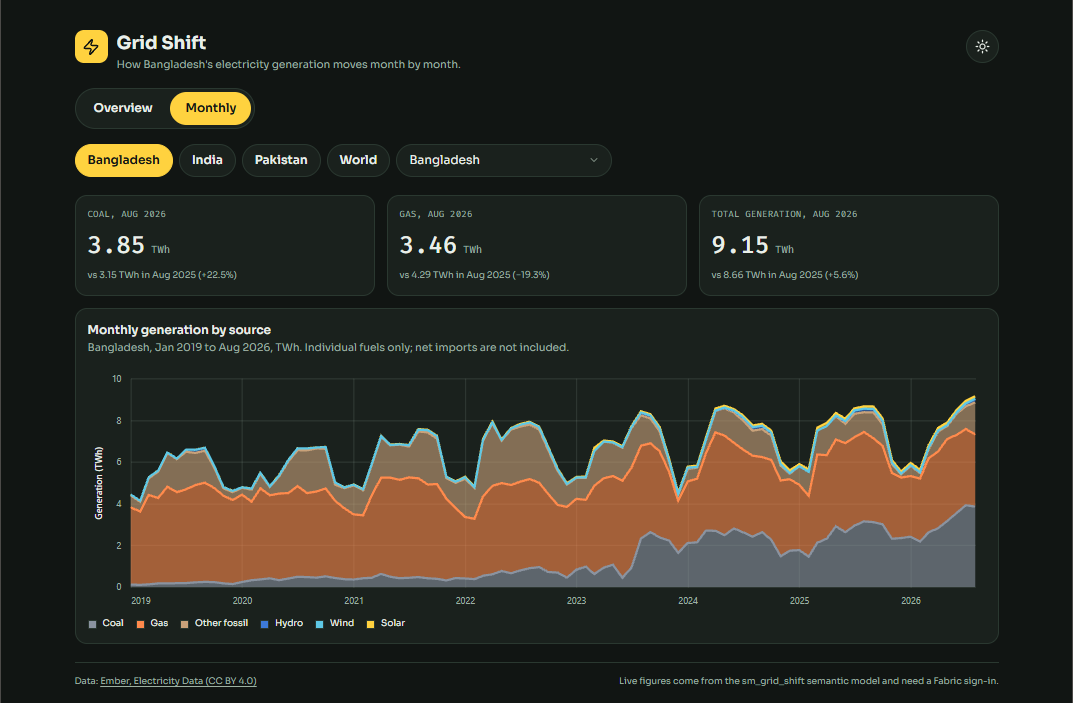
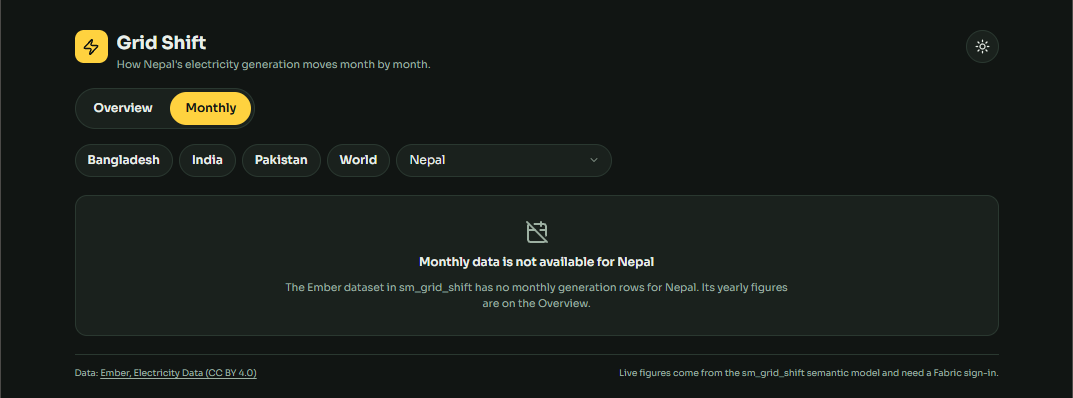
A Fabric App (preview) built on the dataapp template, reading every number from the sm_grid_shift semantic model through the semantic-model connector. No mock data. Two views, Overview and Monthly, with light and dark themes, a phone layout and 44px touch targets.
A watchlist feature writes per-user notes to the app's own Fabric SQL database, to show the app can write as well as read.
The app layer was built with AI assistance — Claude drafted the SQL and Power Query, Claude Code wrote the app code and DAX measures — while I chose the dataset and the story, decided the architecture and warehouse model, ran every step in Fabric, validated the results against Ember's raw data and tested the per-user notes with two accounts.
Pipeline
Built end to end in Microsoft Fabric on a trial capacity in October 2026, on Ember's open electricity data (CC BY 4.0).
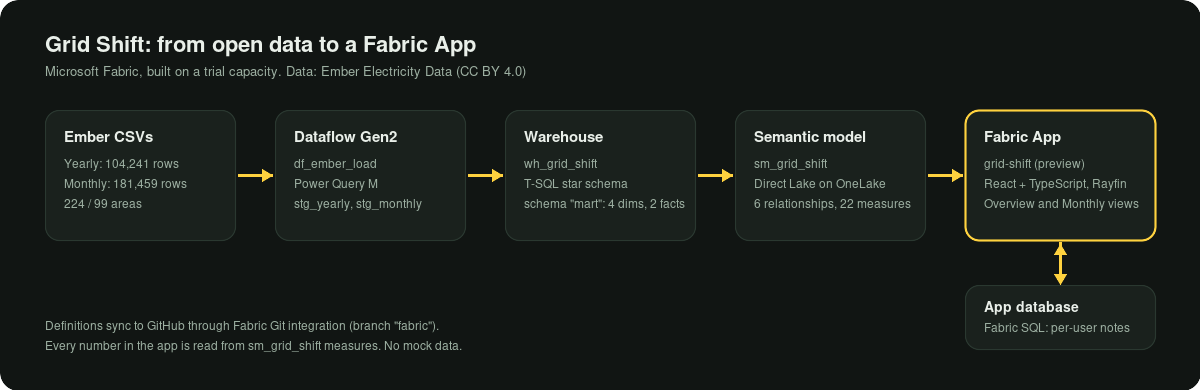
- Load. A Dataflow Gen2 (
df_ember_load) brings Ember's yearly and monthly CSVs into staging tables in a Fabric Warehouse — 104,241 yearly rows across 224 areas (2000–2025) and 181,459 monthly rows across 99 areas (Jan 2019 – Aug 2026). - Model. A star schema in the warehouse's
martschema, built with T-SQL CTAS:dim_source,dim_area,dim_year,dim_date,fact_generation_yearlyandfact_generation_monthly. Row counts and duplicate checks are in the schema script. - Semantic model.
sm_grid_shift, Direct Lake on OneLake, with 6 relationships and 22 DAX measures, edited as TMDL through Fabric Git integration. Summary sources (Clean, Fossil, Total) are never summed with individual fuels. - App. A Fabric App (preview) with delegated sign-in, plus its own Fabric SQL database for per-user watchlist notes following the documented
@rolepolicy pattern.
What the data says
Figures come from the semantic model and were reconciled against Ember's raw CSV.
- Gas is losing share. 64.3% of Bangladesh's generation in 2025, down from a 92.5% peak in 2010.
- Coal took most of it. 21.5% in 2025, from roughly 0% in 2000.
- Imports matter. Net imports are 14.2% of generation.
- Clean power is still about 2%. 2.1% in 2025 — the story is not a solar boom.
- Carbon intensity 696 gCO2e/kWh, on total demand of 118.0 TWh.
Checks and limits
- Reconciled against source. Bangladesh's 2025 values were checked between a DAX query and Ember's raw CSV, and a monthly comparison (Bangladesh coal, Aug 2026 vs Aug 2025) was checked the same way.
- Per-user notes tested with two accounts in separate private browser sessions, with a database check that each note carries its author's owner ID.
- Preview and sign-in. Fabric Apps are in preview, and the live app needs a Fabric sign-in with access to the workspace — so there is no public link. It ran on a trial capacity ending in early November 2026; the screenshots and the recorded demo in the repo are the lasting record.
- Data limits. Ember's latest months are provisional and get revised. Pakistan's monthly series ends earlier than the others, and Nepal has yearly data only — the Monthly view says so rather than rendering an empty chart.
- Three details were not in the docs I read: Direct Lake as the model's storage mode, the database
dialect: mssqlsetting, and thedevUrilocal dev flow.