Customer Experience & Satisfaction
Report pages: Overview · Drivers · Sellers
Screenshots
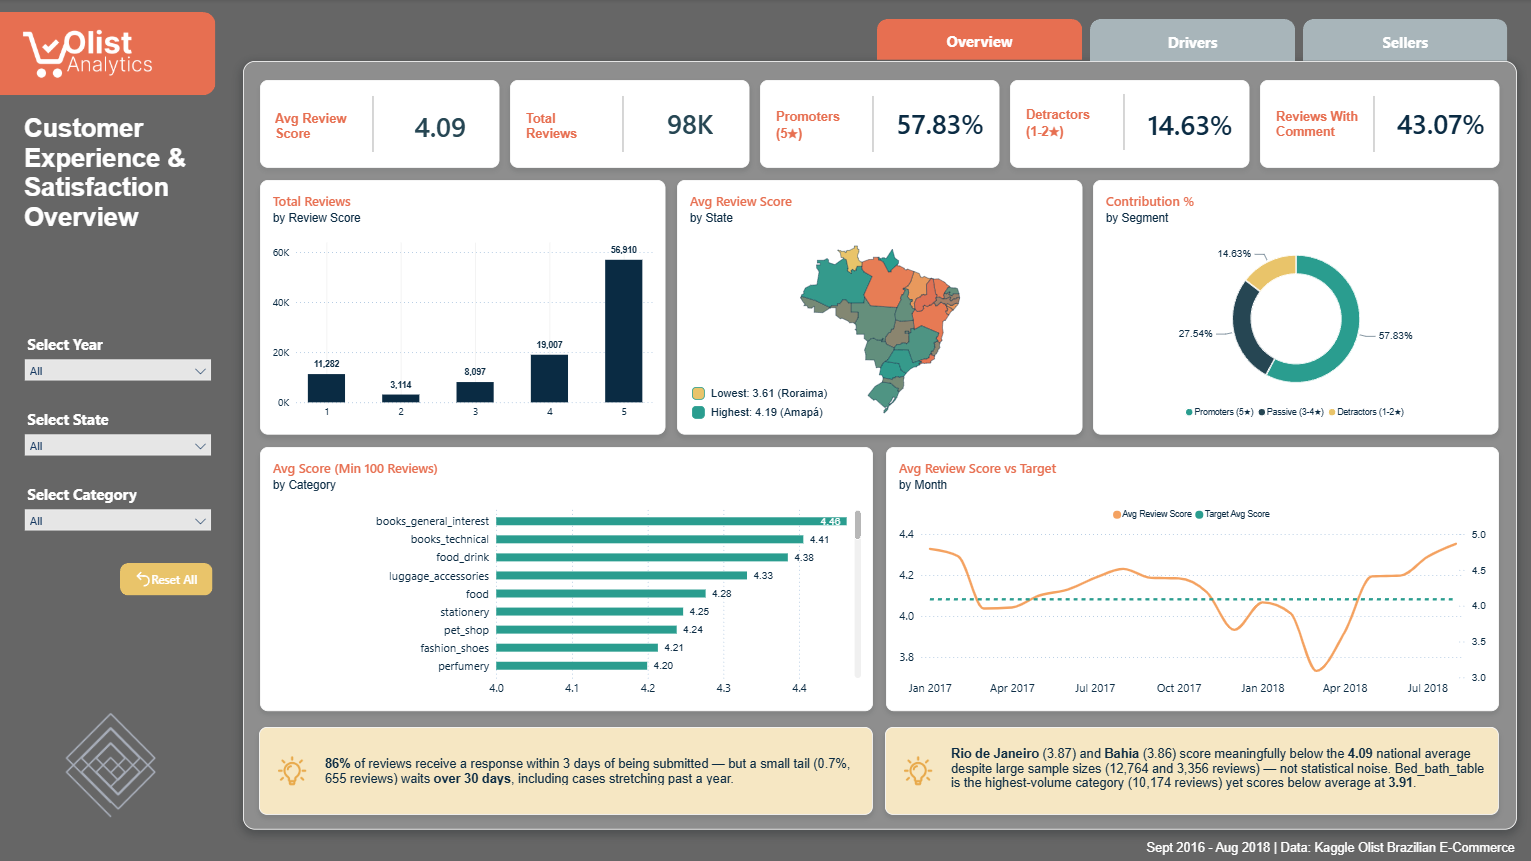
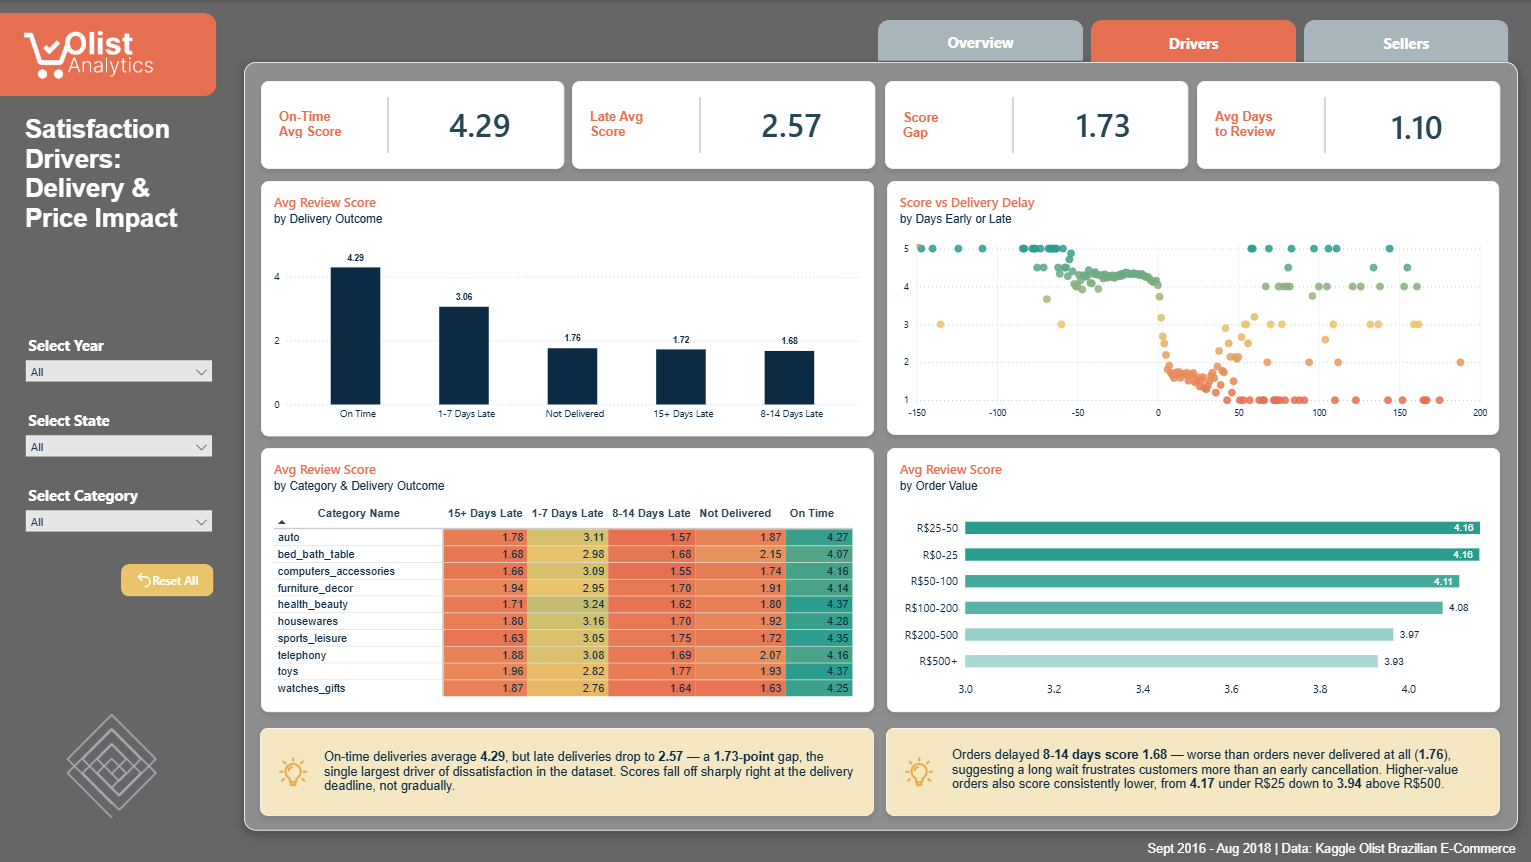
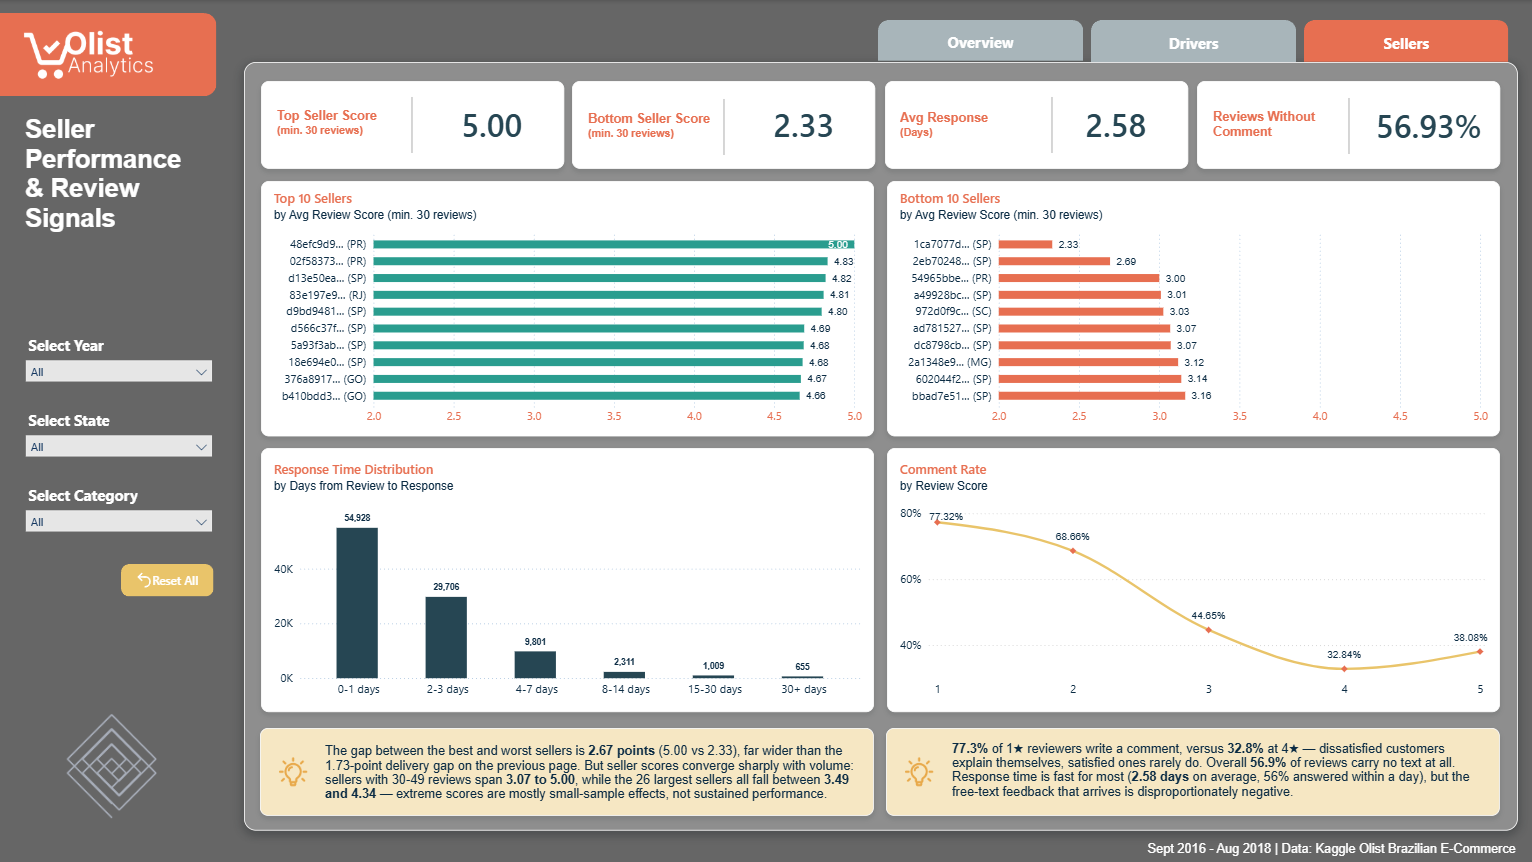
Data Model
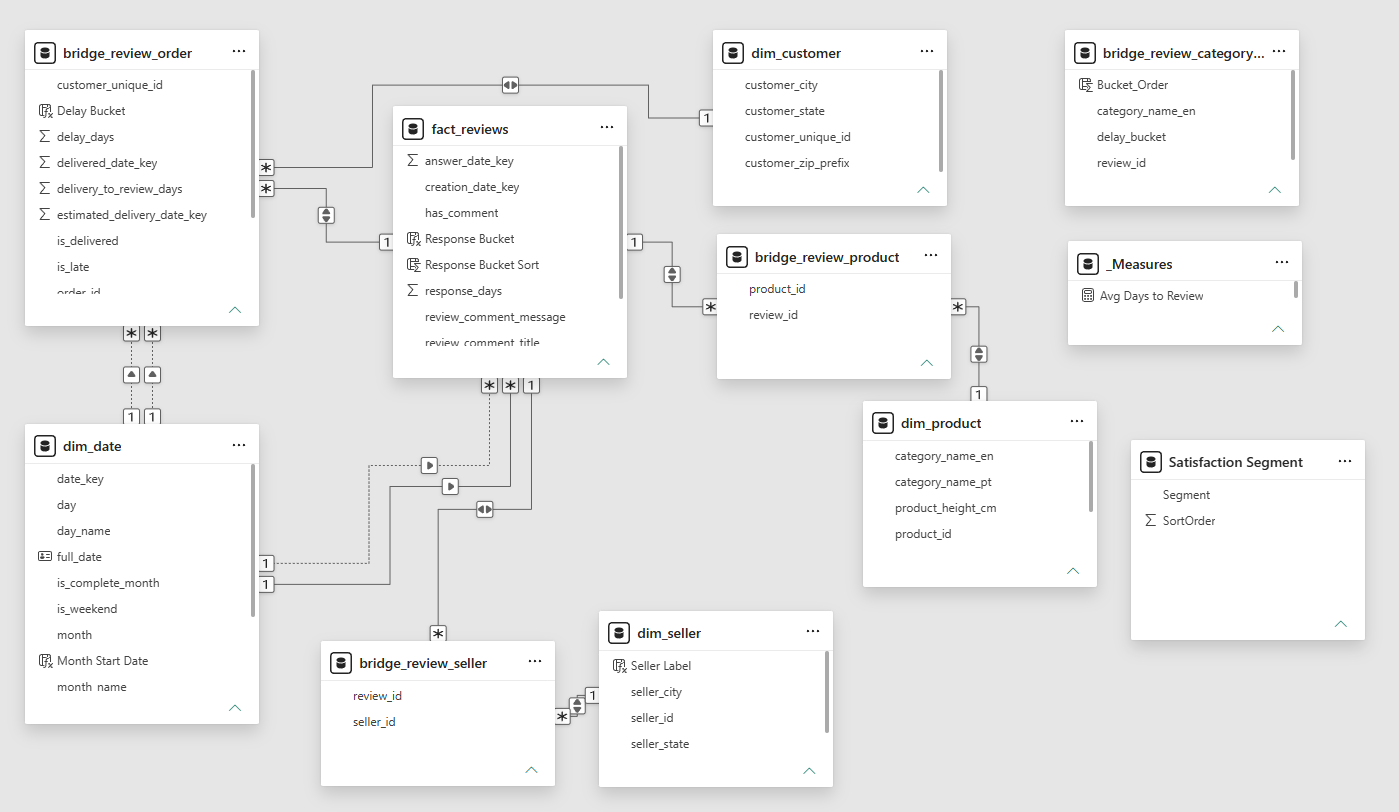
A review-grain fact table with three many-to-many bridges and one deliberately disconnected table, reusing dim_date, dim_customer, dim_seller and dim_product from the earlier two parts without modifying any existing table.
Worth naming precisely: this is not a textbook star schema. Bridges sit between the fact and three of its dimensions, so dim_seller, dim_product and dim_customer are two hops from fact_reviews rather than one; all three bridges use bidirectional cross-filtering; and bridge_review_category_delay has no relationships at all. It is a bridge-heavy dimensional model, and each departure from the clean star was a decision with a reason.
The obvious design puts a single order_id column on the review table. It is also wrong, and quietly so. In this dataset 789 review IDs appear against more than one order, and 547 orders carry more than one review. The duplicated rows are identical on every field except order_id, so a careless DISTINCT hides the problem rather than solving it. bridge_review_order resolves it as two clean many-to-one hops. Each of the three many-to-many relationships across the series was verified with a count query before its bridge was built, not assumed from the table names.
One table is deliberately disconnected. The category-by-delivery-outcome heatmap has to cross two independent many-to-many bridges in a single filter context — product category through one, delivery delay through another. Three separate DAX approaches all returned wrong-but-plausible numbers, the standard failure mode when averaging across two unrelated many-to-many paths. Rather than keep iterating on DAX producing numbers that could not be independently reproduced, the join was pre-flattened in SQL into bridge_review_category_delay and left with no relationships in the model. The heatmap reads it directly, the result is deterministic, and it matches the validation queries exactly. It is an unglamorous solution and it breaks the clean star, which is why it is documented rather than hidden.
Every object in this project is new, and the four shared dimensions are read but never written. dim_date was checked against this project's full date range before any fact load — it already spanned September 2016 to November 2018, so unlike Part 2 no extension was needed. Verifying that up front is the point; Part 2 discovered its gap as a foreign key violation mid-load.
Data quality
- Reviews and orders form a genuine many-to-many: 789 reviews span multiple orders and 547 orders carry multiple reviews. Built
bridge_review_orderrather than forcing a false one-to-one, verified with count queries before designing the schema. - 5,127 reviews, 5.4%, have a negative delivery-to-review interval — the review predates the recorded delivery timestamp. Investigated as a possible timestamp-rounding artifact and ruled out: only 56% fall within seven days, with a much deeper tail. Treated as unreliable timing data and excluded from
[Avg Days to Review], with the rows retained so the anomaly stays inspectable. - 759 rows have a null
order_value, confirmed as the known zero-item orders from Part 1 — cancelled or unavailable before fulfilment. Bucketed as "Unknown" and filtered out of the price chart rather than coerced to zero: a cancelled order is not an order worth R$0. - 701 reviews have no seller attribution, same root cause. Documented rather than silently dropped, since seller-level review counts therefore do not sum to the review total and any share-of-all-reviews measure at seller grain overstates slightly.
BLANK() = FALSEevaluates toTRUEin DAX, sois_late = FALSEsilently swept in 2,865 never-delivered orders. Added explicitNOT ISBLANK()guards. Without them the on-time count read 91,523 instead of 88,658 and the on-time average read 4.22 instead of 4.29 — an error that flatters the result and would have shipped invisibly.- Bridge relationships defaulted to single-direction cross-filtering, silently preventing filters from reaching
fact_reviews. Set all three to bidirectional. Caught the same way as in Part 2: every category rendering an identical value is the symptom. - Averaging review scores across two independent many-to-many bridges returned wrong-but-plausible results through three separate DAX approaches. Pre-flattened the join in SQL into a standalone, deliberately disconnected table. Deterministic, and matches the validation queries exactly.
category_name_enexists in bothdim_productand the flattened table with no relationship between them. Dragging the wrong one into a visual makes every matrix row show the identical grand total. Fixed by verifying the source table of every field, not just its name.- Declaring comment columns as
NVARCHAR(MAX)collapsed CSV import to around ten rows per second. Bounding them toNVARCHAR(4000)dropped the same 98,000-row import from over ten minutes to 41 seconds. - October to December 2016 carries negligible volume — 176, 101 and 45 reviews. Excluded from trend visuals only, via a visual-level filter; the rows remain in all totals and KPIs.
- Category
Unknown, n=1,457, is translation residue rather than a business category, and is excluded from category rankings. The source also contains a genuine typo category,costruction_tools_garden, distinct fromgarden_tools— retained as-is, since silently merging it would misstate the source.
Modelling decisions
- Every measure was validated against an independent SQL query before being trusted in a visual. This is the discipline the project rests on, and it caught three real bugs that would otherwise have shipped silently: the blank-handling error above, a wrong-table field binding that flattened an entire matrix, and a cross-filter direction that made every category look identical. Those queries are published with expected values stated inline, so every figure on the dashboard traces back to the query that confirmed it.
- Minimum sample size chosen from the distribution rather than guessed. Seller rankings require at least 30 reviews. That number came from a threshold sweep: at 5, thirty-six sellers sit tied at a perfect 5.00, making any Top 10 arbitrary. That collapses to two sellers at 10 and one at 20. At 30 the ranking is stable — rank 10 at 4.66 is cleanly separated from ranks 11 and 12 at 4.64 — 630 sellers still qualify, and 83.2% of review links are retained.
- Extreme seller scores are mostly small-sample noise, and the dashboard says so. Average scores are flat across volume bands, so high-volume sellers do not score worse — a plausible-looking hypothesis the data killed. What changes is the range: sellers with 30 to 49 reviews span 3.07 to 5.00, while the 26 largest all fall between 3.49 and 4.34. The page carries that caveat in a callout, because a Top 10 chart invites exactly the wrong conclusion without it.
- Rate measures defined by subtraction where possible.
[Pct No Comment]is defined as1 - [Comment Rate]rather than as ahas_comment = FALSEtest. Both return the same figure here, but the subtraction is immune by construction to the blank-comparison trap, and guarantees the pages reconcile permanently rather than by coincidence. - Role-playing date dimension.
fact_reviewsandbridge_review_orderrelate todim_datefour times in total. Only review creation is active; the rest are invoked withUSERELATIONSHIP(). Only one can be active at a time — the direct path from the bridge and the path through the fact table together form a loop. - Trend visuals exclude statistically thin months, filtered to January 2017 through August 2018. Outside that window monthly review counts fall to between 45 and 176, against 5,000 to 9,000 in a typical month.
Findings
- Late delivery is the single largest driver of dissatisfaction in the dataset. On-time deliveries average 4.29; late deliveries average 2.57 — a 1.73-point gap. Scores fall off sharply right at the delivery deadline rather than degrading gradually, which suggests customers react to the broken promise itself, not to waiting.
- A long wait is worse than no delivery at all. Orders delayed 8 to 14 days score 1.68, below orders never delivered at 1.76. Customers appear to forgive an early cancellation more readily than an extended, unresolved wait.
- Unhappy customers explain themselves; satisfied ones don't. Comment rate falls from 77.3% at one star to 32.8% at four, then ticks back to 38.1% at five. The overall 43.07% rate badly understates how much written feedback concentrates in the one and two star bucket — free-text review mining on this platform disproportionately samples the unhappy.
- Extreme seller scores are mostly small-sample effects. The best and worst qualifying sellers differ by 2.67 points, but that spread collapses as volume rises: sellers with 30 to 49 reviews range across 1.93 points, the 26 largest span only 0.85. Seller-level satisfaction converges hard toward the 4.09 platform average.
- Higher-value orders score consistently lower, from 4.16 under R$50 down to 3.93 above R$500 — a modest but monotonic decline, suggesting expectations scale with price faster than service does.
- Response is fast for almost everyone, and glacial for a few. 86% of reviews get a response within three days, but a 655-review tail waits over 30 days, with the longest cases stretching past a year.