Logistics & Delivery Performance
Report pages: Executive Overview · Delay Analysis · Seller & Freight
Screenshots
Data Model
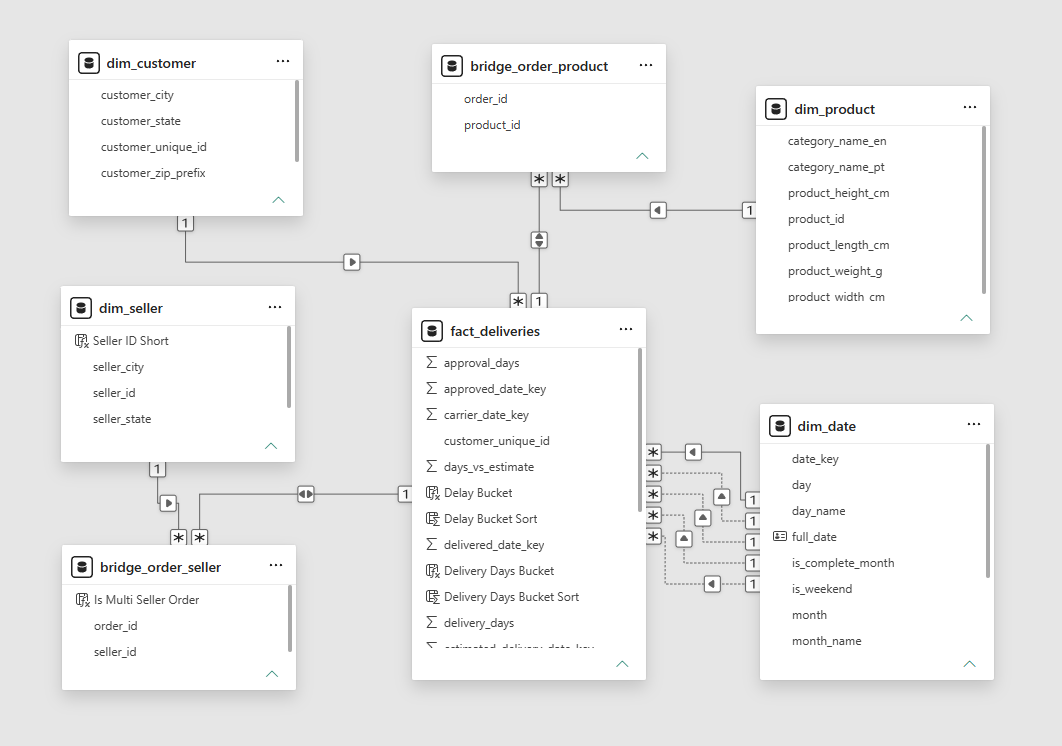
A star schema centred on fact_deliveries, at one row per order, carrying five role-playing date keys — purchase, approved, carrier handoff, delivered and estimated delivery — along with aggregated freight value and pre-computed timing measures. It reuses dim_date, dim_customer, dim_seller and dim_product from the sales model without modifying any of those tables.
An order can legitimately involve more than one seller, or span more than one product category. Forcing a single seller or category onto each order row would misrepresent roughly 1.3% of orders and undercount category-level performance. Two lightweight bridge tables — bridge_order_seller and bridge_order_product — let both relationships resolve as two clean many-to-one hops rather than one uncontrolled many-to-many.
dim_order from the sales model already existed at one-row-per-order grain, so adding delivery columns there was tempting. fact_deliveries was built as a fully separate table instead, so nothing here could alter a table the published sales dashboard depends on. The same principle applied upstream: rather than updating stg_orders in place, it was duplicated to stg_orders_logistics before cleaning, leaving the earlier pipeline untouched.
Data quality
- The Part 1 cleaning script filled missing delivery timestamps with a placeholder
1900-01-01rather than leaving them null. Rewrote the script to usepd.to_datetime(errors='coerce'), producing true nulls, and separately patched the already-loaded staging table withUPDATE ... SET ... = NULL. - 2,965 orders have no
order_delivered_customer_dateand were never confirmed delivered. Confirmed as expected: largely explained by a visible drop-off between carrier handoff and delivery — 1,182 of the 2,965 — rather than by cancellations. dim_date, built for Part 1, covered only the purchase-date range and did not extend far enough to coverorder_estimated_delivery_date, which projects up to 26 days past the last purchase date. Extendeddim_datewith the missing range only, touching no existing rows.- Both bridge table relationships defaulted to single-direction cross-filtering, silently preventing category and seller filters from reaching
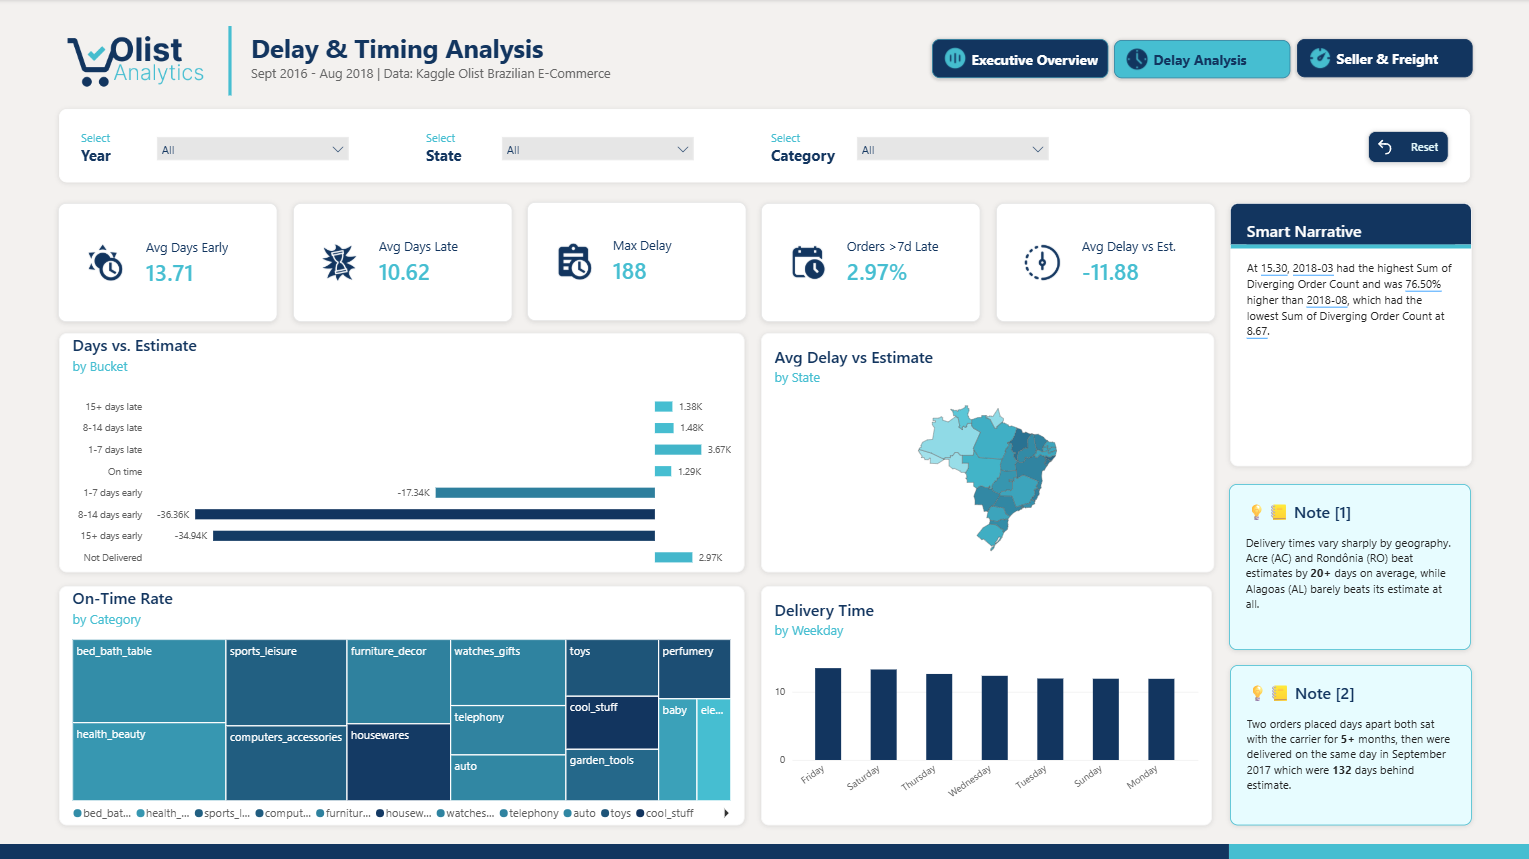
fact_deliveries. Changed both to bidirectional cross-filtering. - A small number of orders show extreme delivery delays, up to 132 days past estimate. Verified against raw timestamps rather than assumed to be bad data — confirmed as a real event, with two unrelated orders both clearing in an apparent batch resolution in September 2017.
- 59% of sellers, 1,824 of 3,095, have fulfilled fewer than ten orders. Applied a minimum sample size threshold of 30 orders before a seller enters any ranking measure, so a tiny-sample seller cannot produce a misleadingly perfect or terrible rate.
Modelling decisions
- Blank-safe rate calculations. Every rate measure explicitly excludes rows where the outcome is unresolved —
is_lateblank, meaning the order was never confirmed delivered — rather than relying on DAX's default blank handling. An early version of the on-time rate measure that did not do this returned 95% instead of the correct 91.9%: a three-point error that would have overstated performance on a published dashboard. - Role-playing date dimension.
fact_deliveriesrelates todim_datefive separate times. Only the purchase-date relationship is active by default, matching the sales model's convention; the other four are invoked explicitly withUSERELATIONSHIP()wherever a measure needs to pivot onto a different date stage. - Minimum sample size for seller rankings. Any top-seller measure requires at least 30 resolved orders before a seller qualifies, so a seller with two orders and a lucky outcome cannot show a meaningless 100% rate.
- Trend visuals exclude statistically thin months. Delivery-time trends are filtered to February 2017 through August 2018. Outside that range monthly order counts fall below 300, against 5,000 to 8,000 in a typical month, letting a handful of orders swing the average enough to produce misleading spikes at both ends.
Findings
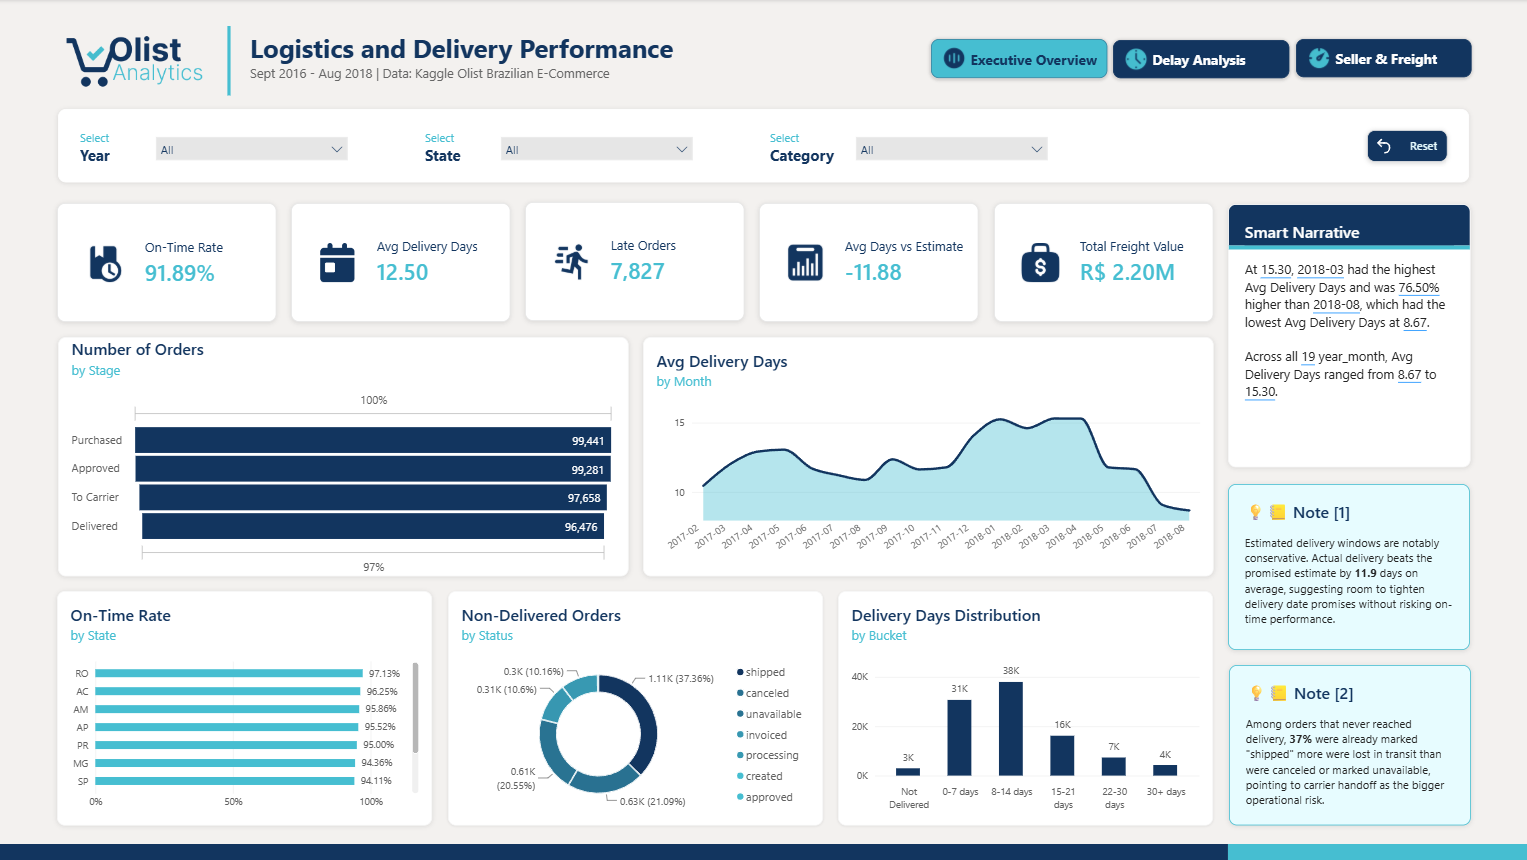
- Delivery beats the promised estimate by 11.9 days on average. The estimated delivery windows are notably conservative — actual delivery consistently arrives well ahead of what is promised, suggesting room to tighten estimates without risking on-time performance.
- Delivery times follow a clear seasonal pattern, peaking above 15 days across the November 2017 to February 2018 holiday period, then improving steadily to around 9 days by August 2018.
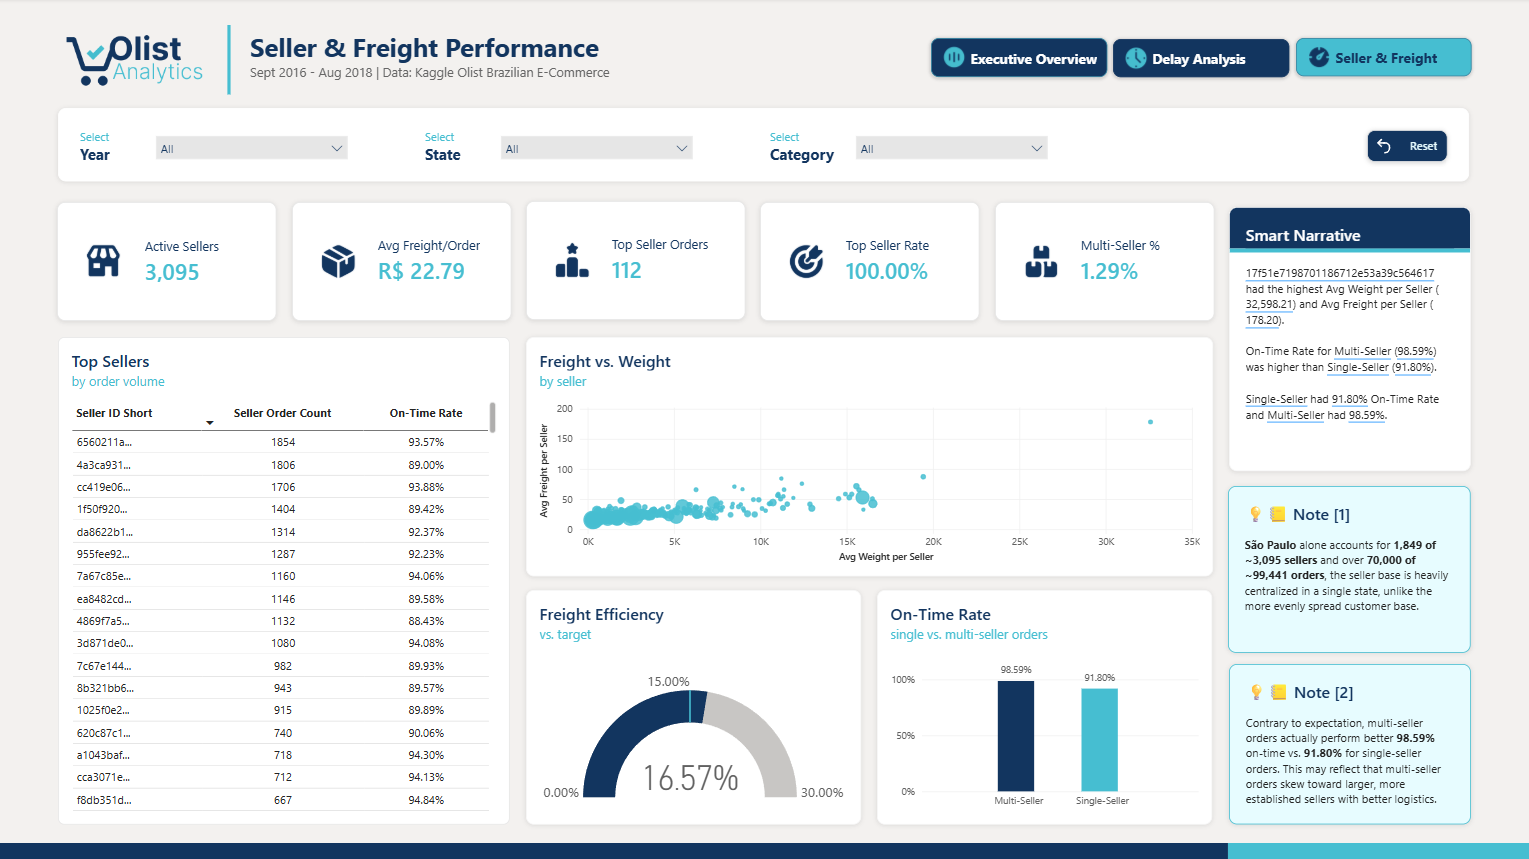
- The seller base is heavily centralised. São Paulo alone accounts for 1,849 of roughly 3,095 sellers and over 70,000 of roughly 99,441 orders — far more concentrated than the customer base, which spreads more evenly across states.
- Multi-seller orders outperform single-seller orders. Against the intuitive assumption that splitting an order across sellers would hurt coordination, multi-seller orders show a higher on-time rate at 98.6% versus 91.8% — likely because they skew toward larger, more established sellers with better logistics.
- Among orders that never reached delivery, more were lost in transit than cancelled. 37% of non-delivered orders were already marked shipped, a larger share than cancelled at 21% or unavailable at 21% — pointing to carrier handoff, not customer cancellation, as the bigger operational risk.