Sales & Revenue Performance
Report pages: Executive Overview · Category & Product Deep Dive · Customer & Payment Insights
Screenshots
Data Model
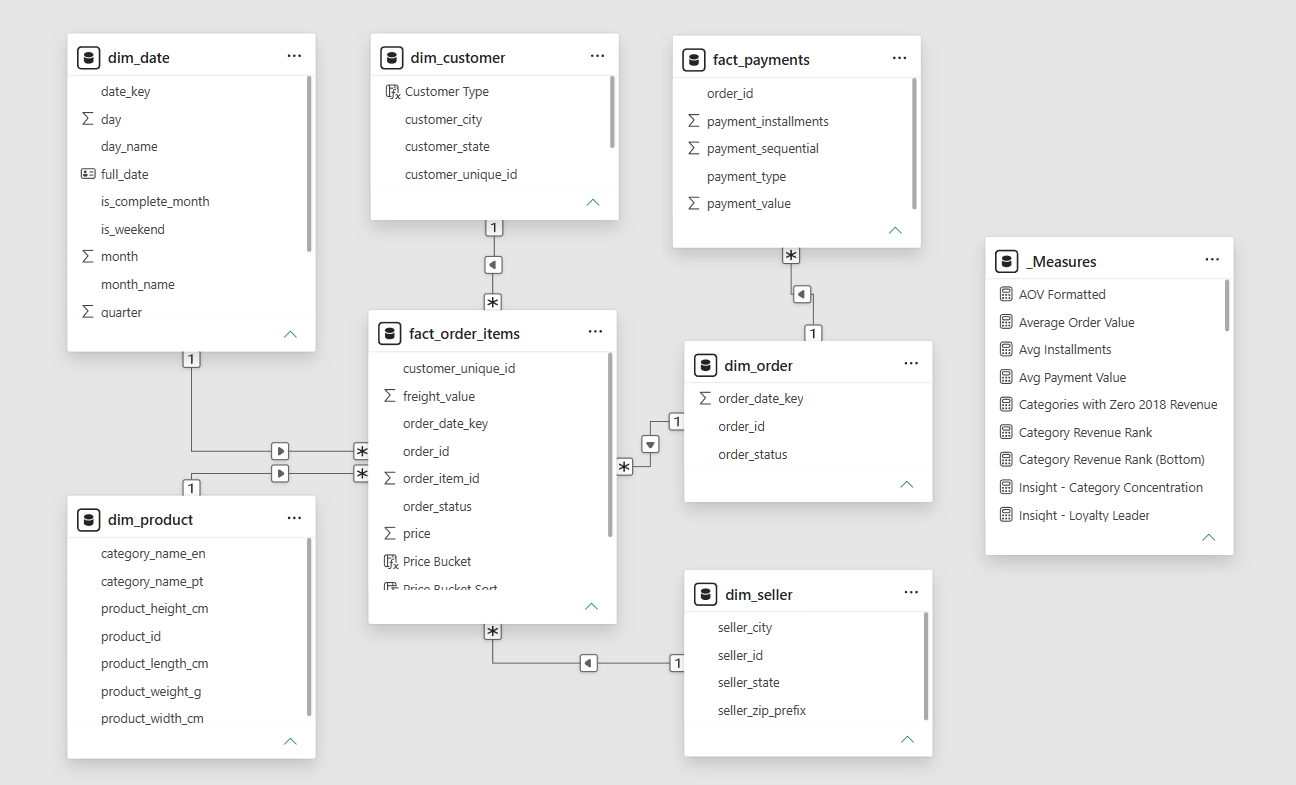
Two fact tables at different grains — fact_order_items, one row per order line item, and fact_payments, one row per payment installment record — with dim_date, dim_customer, dim_seller, dim_product and dim_order as dimensions.
Both facts share order_id, but the field is unique in neither: an order has multiple line items and multiple payment records. Relating them directly produces an uncontrolled many-to-many relationship that silently inflates revenue and payment totals depending on query context. dim_order sits between them as a proper dimension, so both facts relate to it many-to-one — a clean, predictable star pattern.
Data quality
Real datasets are messy. Documenting these decisions matters more than the charts — it shows how the problems were reasoned about, not just what got built.
customer_idis order-specific — the same person receives a new ID for every order. Usedcustomer_unique_idas the true customer key for all customer-level metrics, including repeat rate and unique customer counts.- The
order_itemstopaymentsrelationship was many-to-many. Introduceddim_orderas a bridge dimension so both facts relate many-to-one. - 775 orders had no rows in
order_items, having been cancelled or become unavailable before fulfilment. Confirmed as expected: the fact grain is order line item, so these are naturally excluded. - 623 products carried untranslated, Portuguese-only category names. Manually mapped the three missing categories to the translation table.
- 461 orders marked
canceledstill had line items, having been cancelled after fulfilment began. Built a primaryTotal Revenuemeasure excluding cancelled and unavailable statuses, alongside a separateTotal Revenue (Gross)measure for demand analysis. - The final month of data, September 2018, was incomplete — the extract was taken mid-month. Filtered all trend visuals to complete months only, through August 2018, to avoid a misleading revenue cliff.
- Datetime columns imported as SQL Server
time, silently dropping the date portion. Diagnosed viaINFORMATION_SCHEMA.COLUMNSand fixed by re-importing with an explicityyyy-MM-dd HH:mm:ssformat mapping.
Modelling decisions
- Revenue definition.
Total Revenueexcludes cancelled and unavailable orders to reflect realised performance, withTotal Revenue (Gross)available for demand analysis. Ratio measures such as Average Order Value use the same filtered population in numerator and denominator, so the two never disagree. - Year-over-year growth. Calculated as a fixed comparison of full calendar 2018 against full calendar 2017, rather than an open date range — an open range compares a partial year against a complete one and produces misleading results.
- Repeat customer rate. Calculated on a lifetime basis rather than within the selected period, so a customer whose two orders fall in different years is not counted as non-repeating.
- Statistical significance threshold. The top loyalty state insight considers only states with at least 500 customers, so a small, low-volume state where one or two repeat customers dominate the percentage cannot surface as a false leader.
Findings
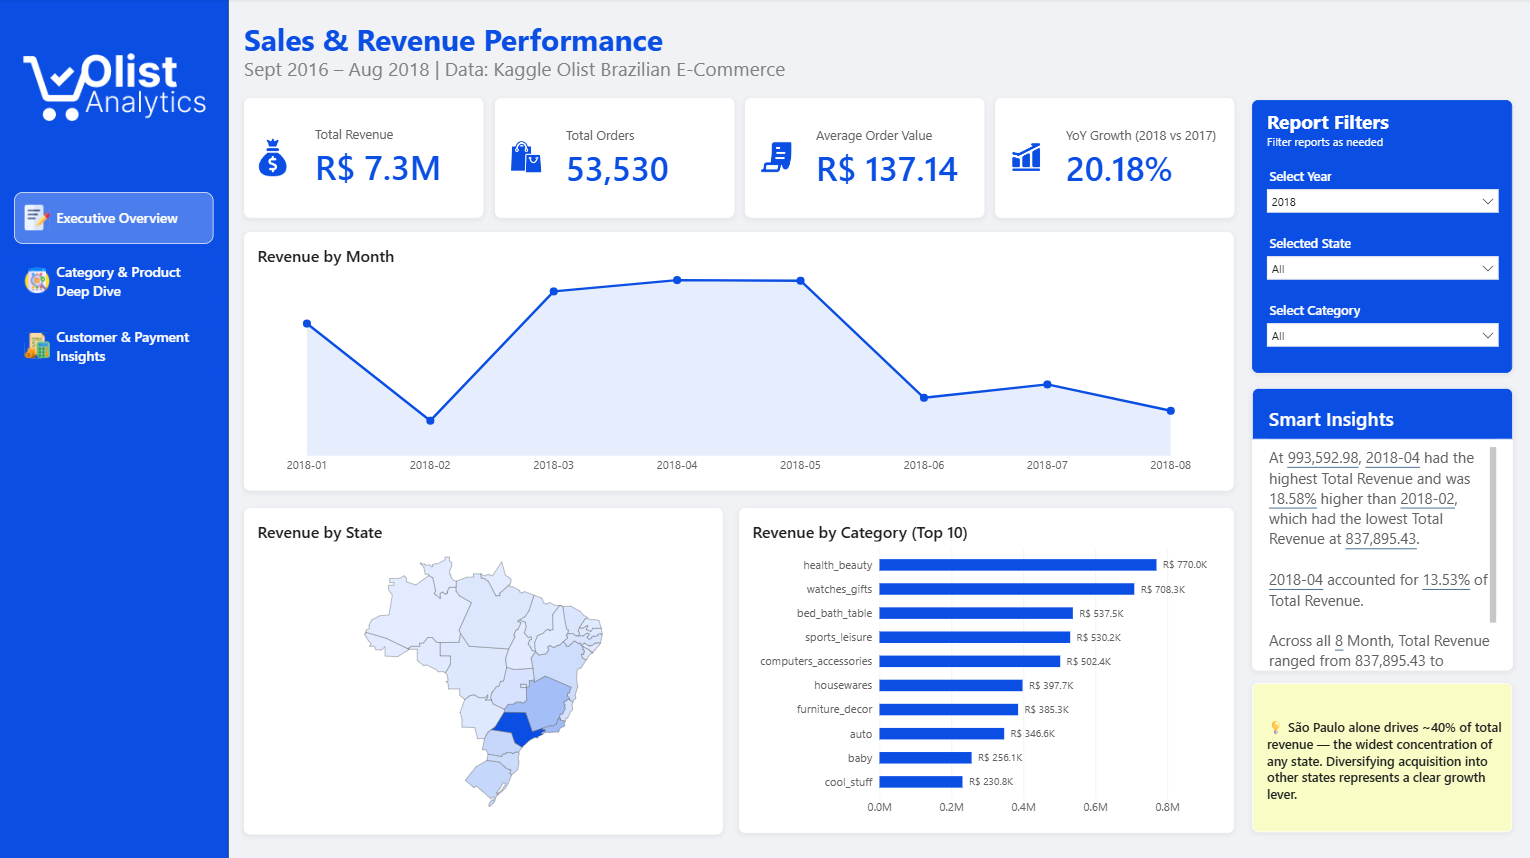
- São Paulo drives around 40% of 2018 revenue — the widest concentration of any state, and a signal that customer acquisition is heavily weighted toward one region.
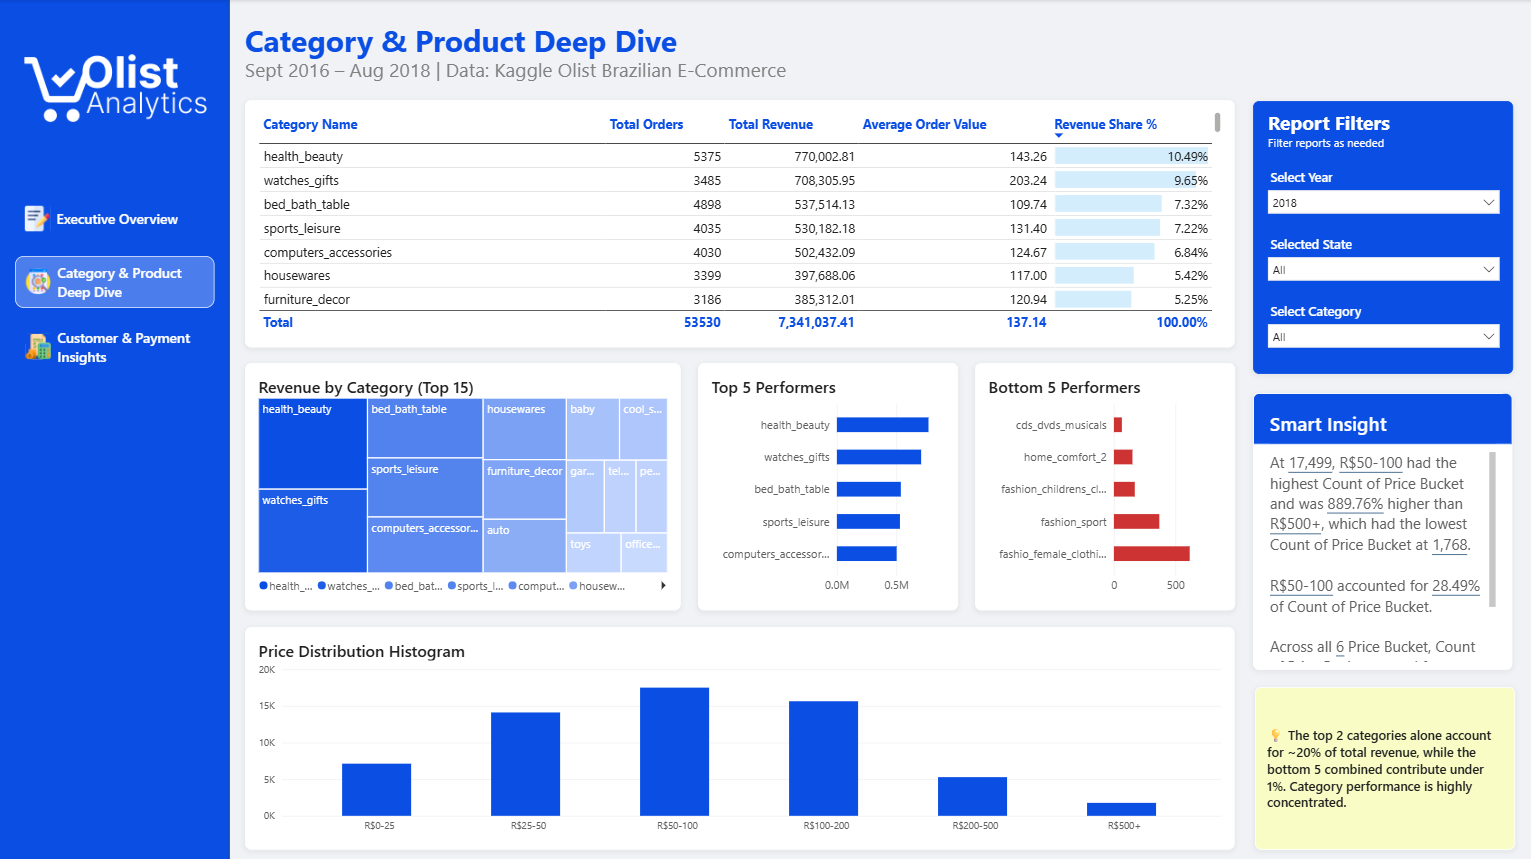
- Revenue concentrates at category level too. The top two categories account for roughly 20% of total revenue; the bottom five combined contribute under 1%.
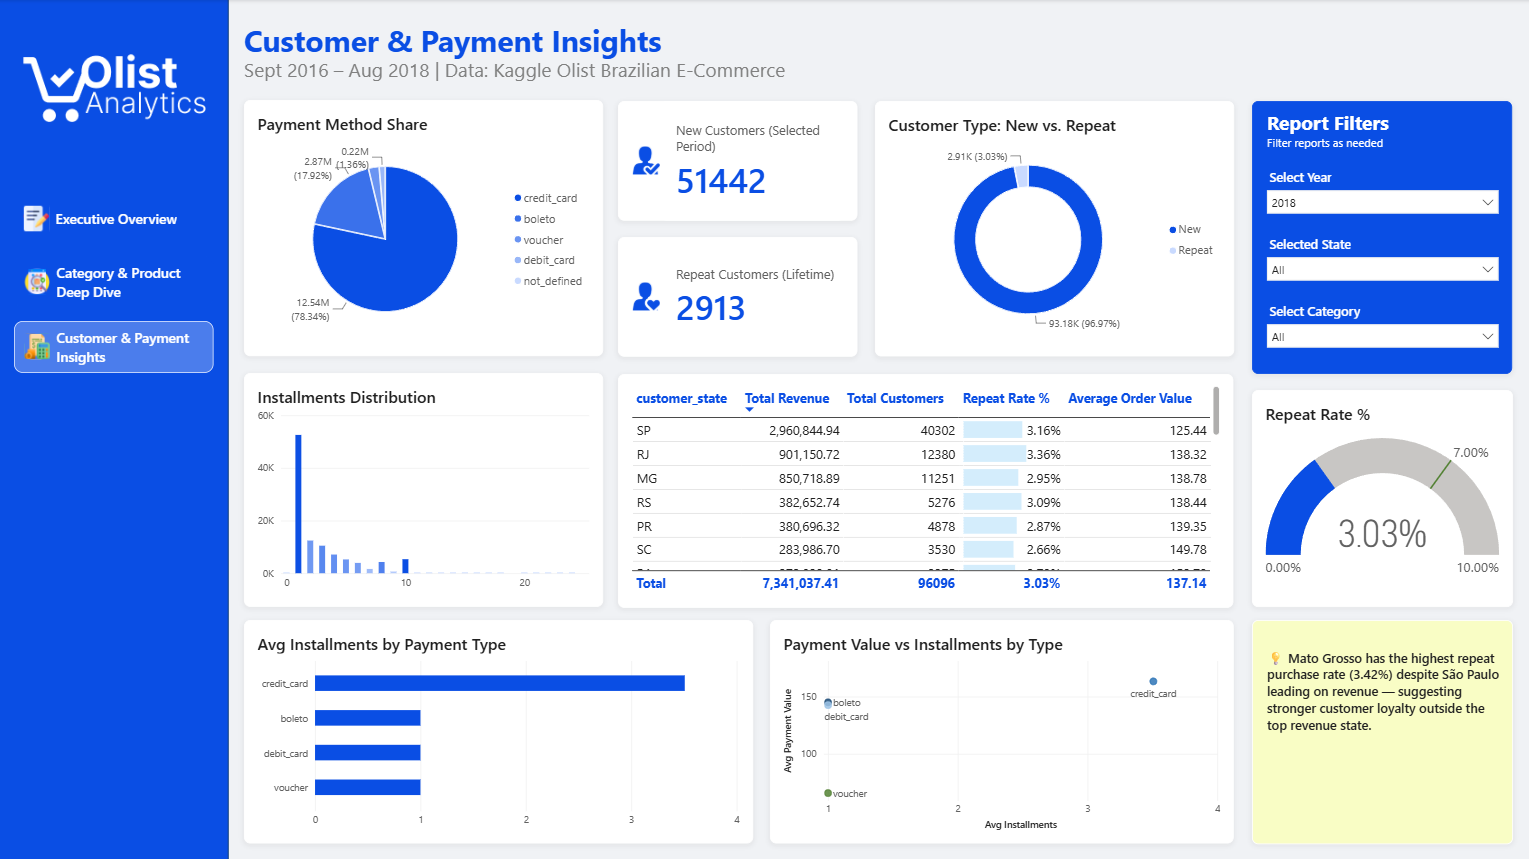
- The repeat purchase rate is very low, around 3%, consistent with a multi-vendor marketplace lacking platform-level loyalty mechanisms. The state with the strongest repeat behaviour, among those with meaningful sample size, is not the state with the most revenue — loyalty and revenue scale do not move together.
- Credit card is the platform's de facto financing mechanism, carrying both the highest average installment count and the highest average order value, while boleto, debit and voucher payments are overwhelmingly pay-in-full, lower-value transactions.