Live Aircraft Data — Fabric Real-Time Intelligence
Report pages: OpenSky snapshot
Dashboard
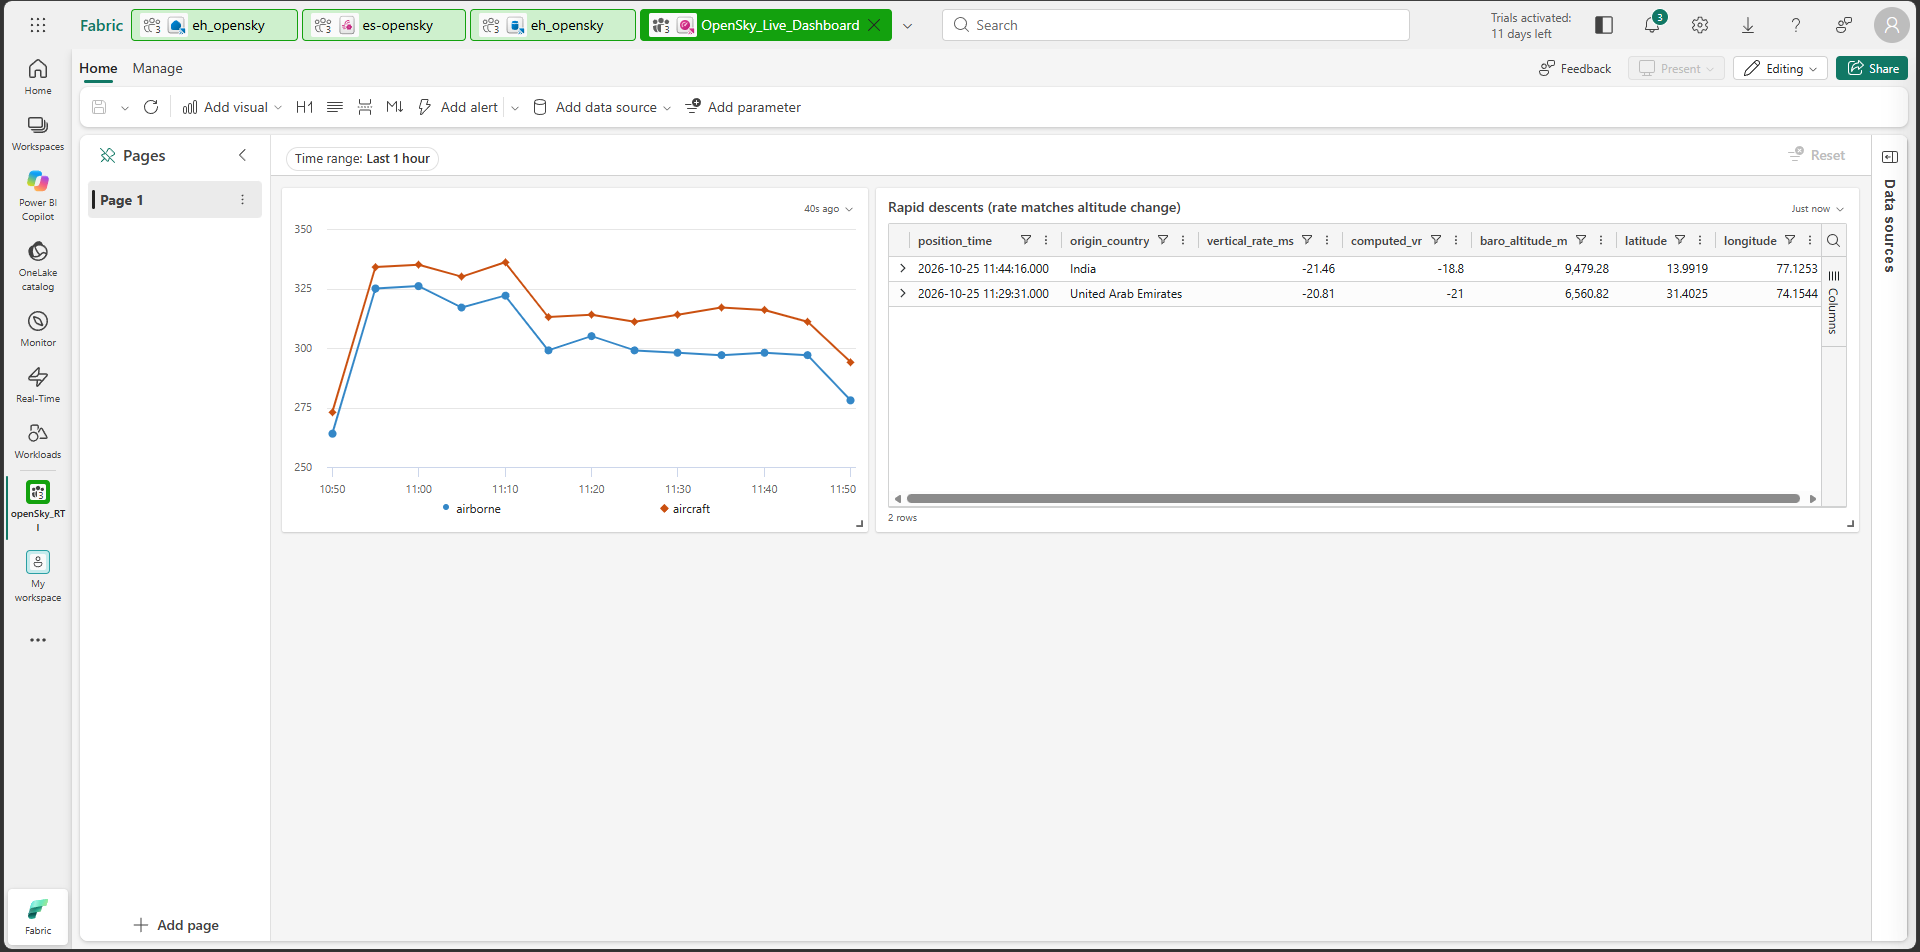
A Real-Time Dashboard with two tiles, built on an Eventhouse table of live aircraft states from the OpenSky Network. Tile 1 shows distinct aircraft per 5 minutes and honours the dashboard time range. Tile 2 lists airborne readings below -20 m/s whose reported vertical rate is within 5 m/s of the rate calculated from the altitude change.
Tile 2 was tightened after a first version that used the reported rate alone: most of that version's hits looked inconsistent with altitude.
Pipeline
Built in one session on a Fabric trial on 25 Oct 2026. The repo includes a log of the problems hit along the way.
- Source. The OpenSky REST API for a bounding box over South Asia (latitude 5 to 35, longitude 60 to 100), polled by a Python producer set to a 60-second interval. OpenSky requires OAuth2 client credentials, so the producer fetches a token and refreshes it before it expires.
- Ingestion. The producer sends one JSON event per aircraft to an Eventstream custom endpoint over the Event Hubs protocol, and the Eventstream feeds an Eventhouse table by direct ingestion. I used a script because the Eventstream HTTP source (preview) is documented with Anonymous, Basic and API key authentication and says OAuth is not supported; I did not test the HTTP source.
- Store. The destination setup created the table
aircraft_states. A saved KQL function,aircraft_clean(), converts epoch seconds to datetimes and keeps one row per aircraft and position time. - Alert. An Activator rule created from the second dashboard tile checks
vertical_rate_msbelow -20 every 5 minutes.
Data and findings
- Volume. 54,587 events ingested between 10:16 and 13:34 UTC, a span of 3 h 18 min with gaps, covering about 1,086 distinct aircraft (a
dcountestimate). - Repeated positions. Each poll resends aircraft that have not reported a new position, so
aircraft_clean()removed 8,583 of the 54,587 rows (about 15.7%), mostly repeats. - Registration, not location. In a query at 11:06 UTC India led with 408 distinct aircraft, then the UAE with 47.
origin_countryis inferred from the transponder address, so this is registration country, not where the aircraft were flying. - Reported rapid descents often disagreed with altitude. On the final data, 23 of the 26 airborne readings reported below -20 m/s had an earlier reading from the same aircraft 5 to 120 seconds before, so a rate could be calculated from the altitude change. 4 agreed (within 5 m/s, a tolerance I chose) and 19 did not. An earlier run on partial data found 12 readings, 2 agreed and 10 did not. I did not investigate why they disagree.
Alert rule
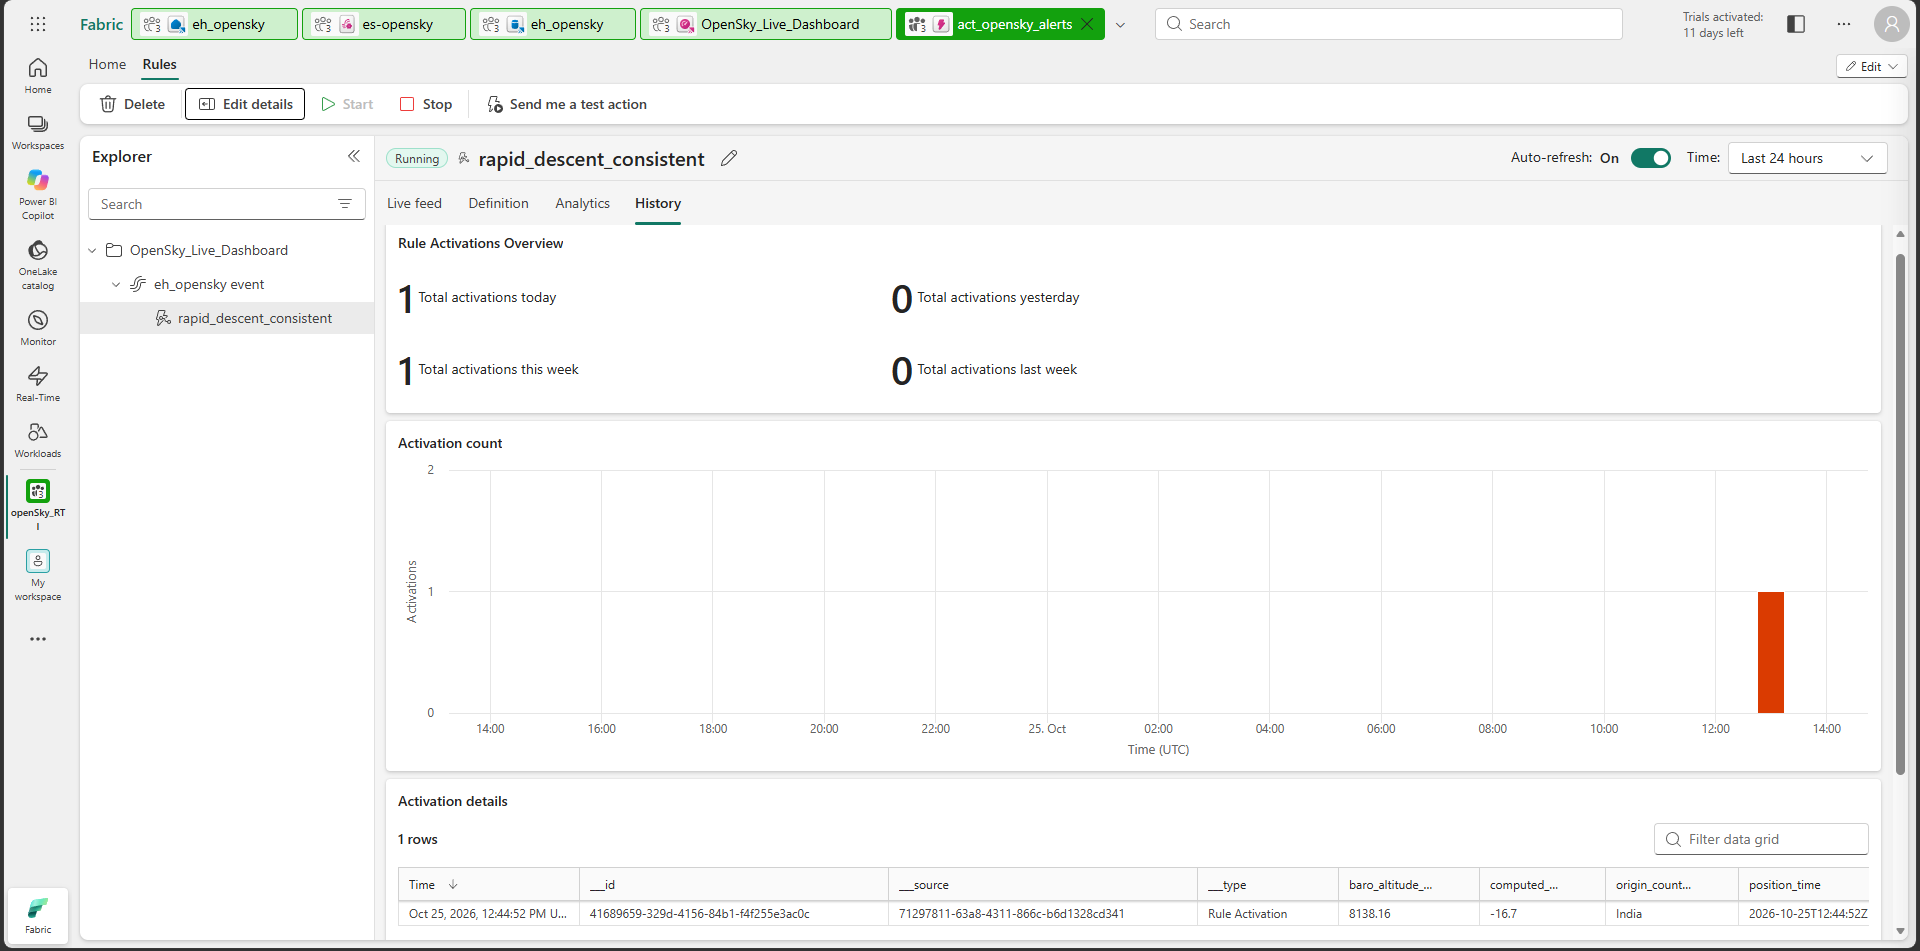
rapid_descent_consistent was created from tile 2 and showed Running. At about 13:03 UTC its History tab showed 1 recorded activation, a borderline case: reported -21.46 m/s against -16.7 m/s calculated from altitude.
Notification delivery is not verified. The account has no working mailbox or Teams subscription: the email test failed and a Teams subscription error was shown.
Power BI report
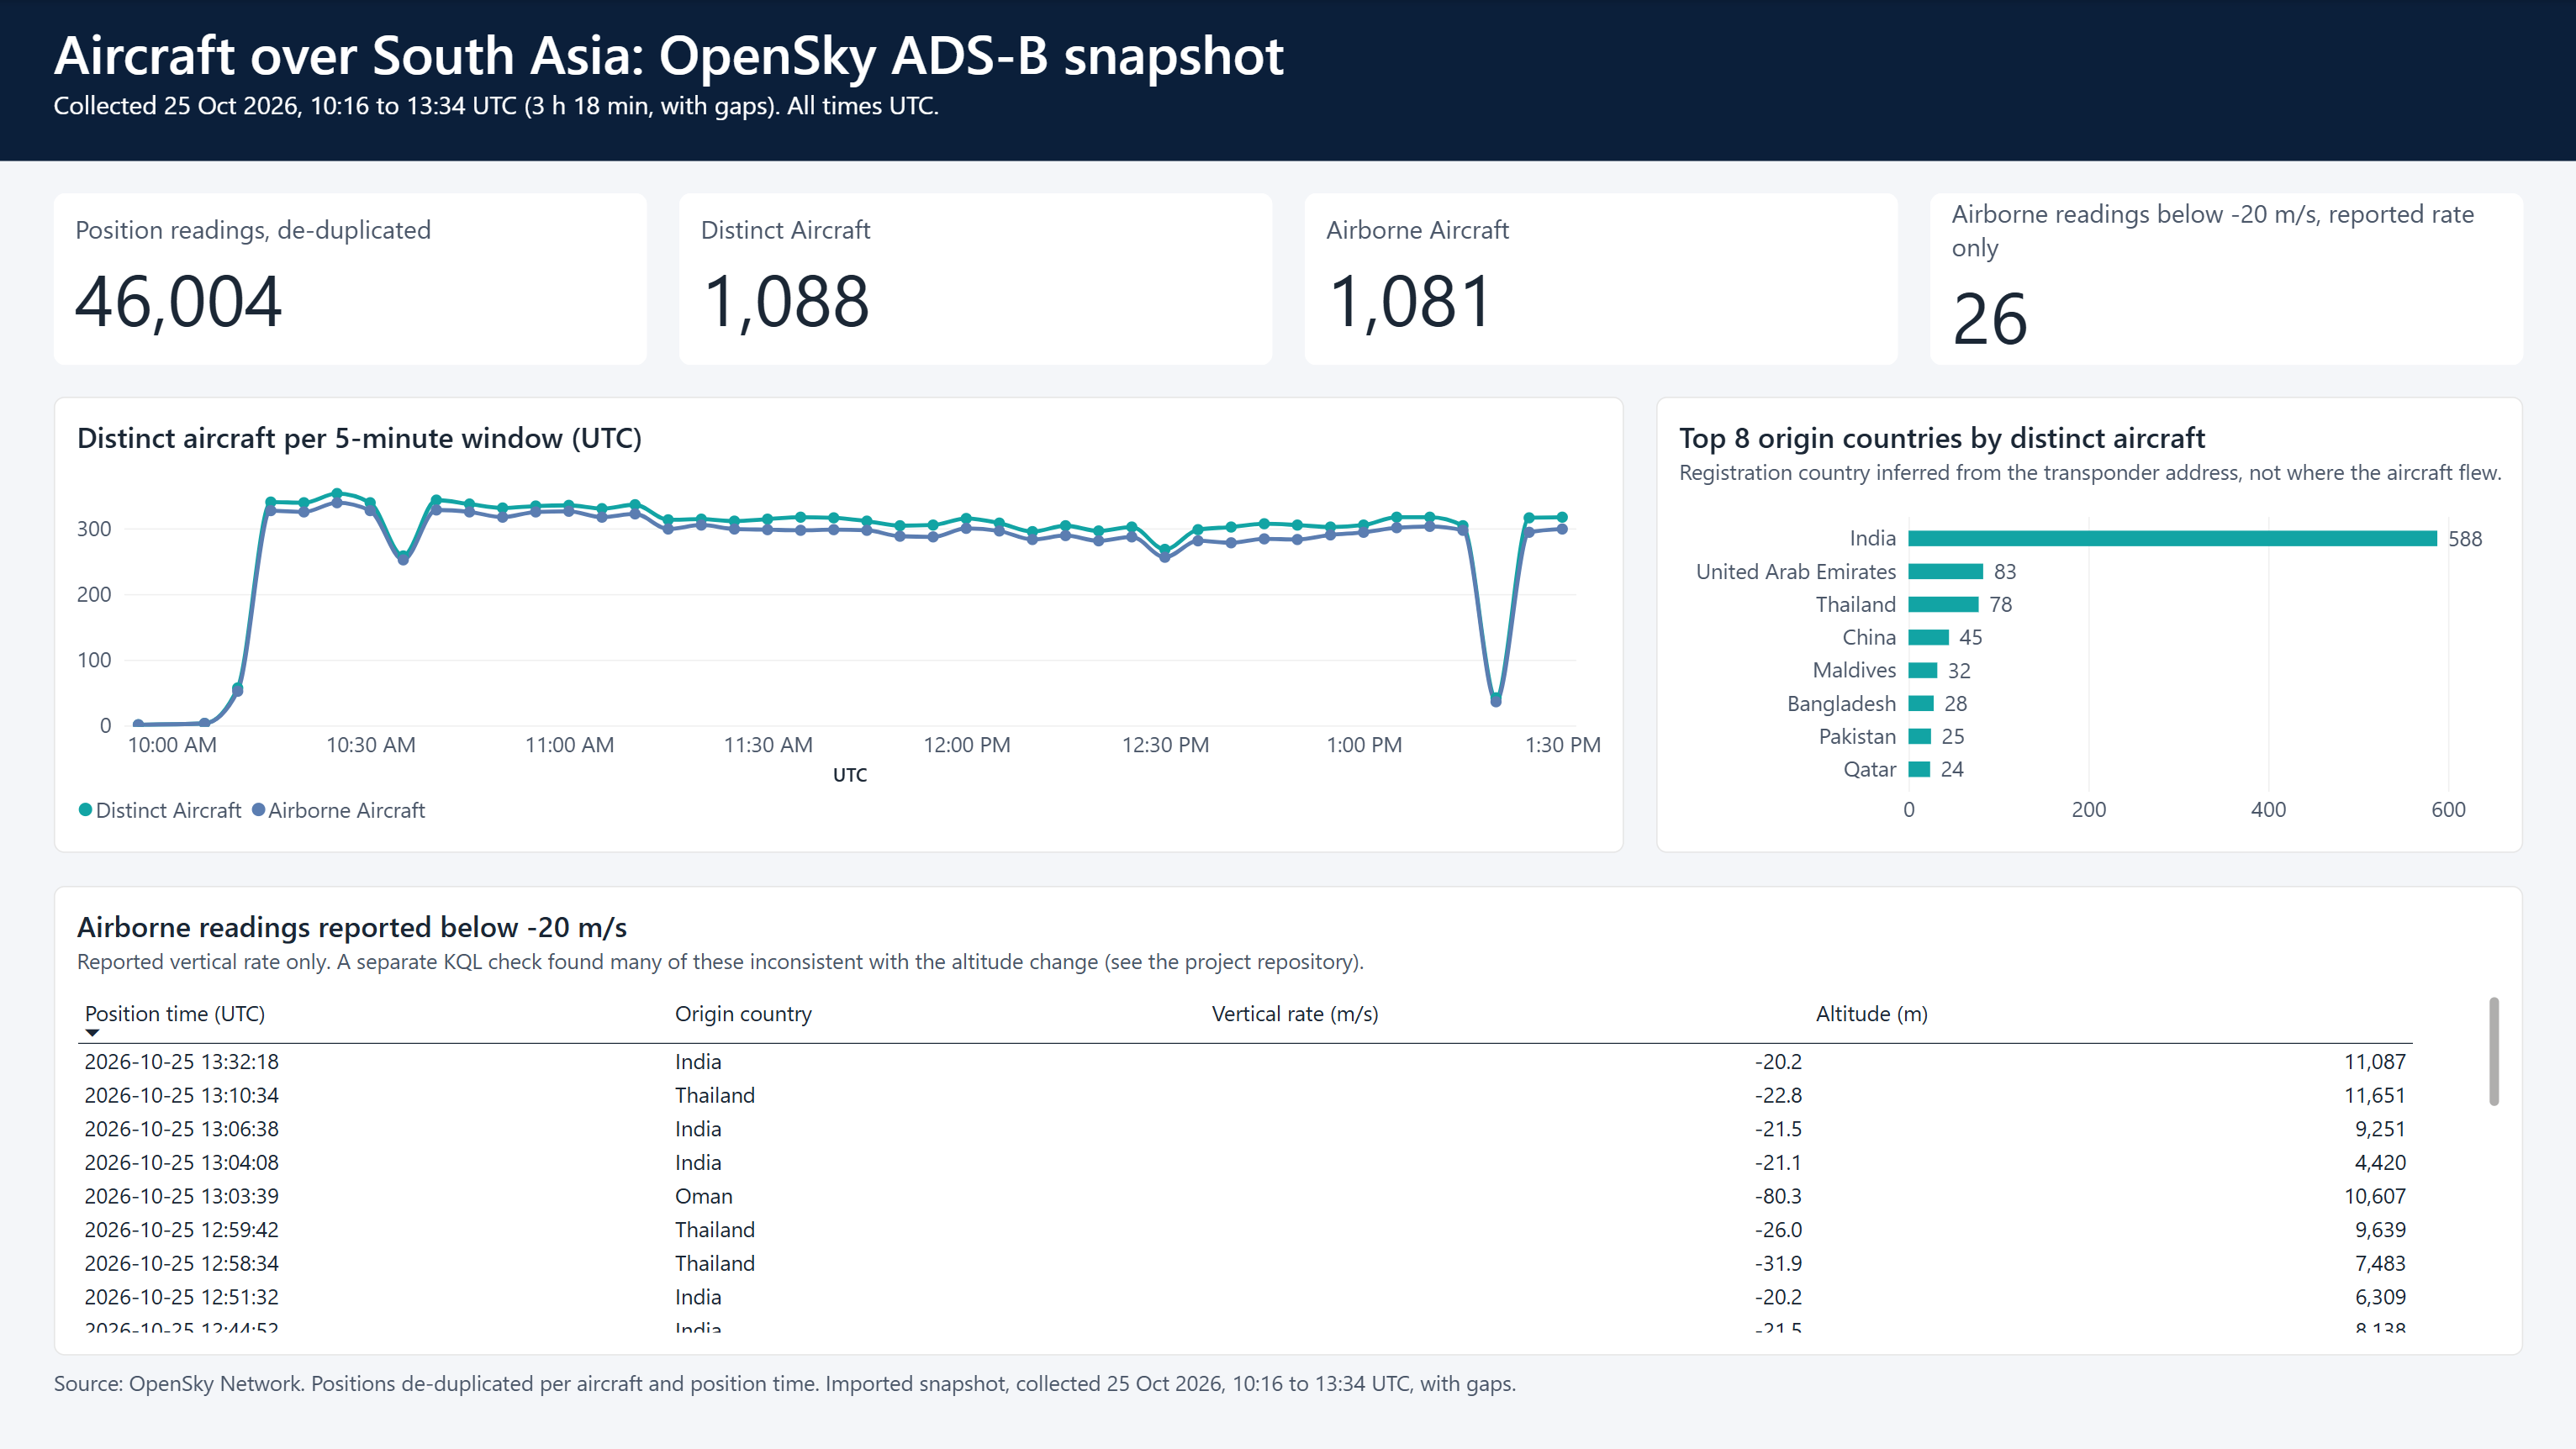
A one-page Power BI report on an imported snapshot of aircraft_clean() (46,004 rows), not a live connection to the Eventhouse. Four KPI cards, distinct aircraft per 5-minute window, the top 8 origin countries, and a table of the 26 airborne readings reported below -20 m/s.
The report was built with Claude Code and Microsoft's Power BI authoring plugin.
Checks. The five count measures match a KQL cross-check on the final data (46,004 / 1,088 / 1,081 / 26 / 21), the table's 26 readings equal the Readings Below -20 m/s measure, and the nine rows at the top of the table match a DAX query on the model. The top-8 countries measure was checked with a DAX query only, not in KQL.
Limits. The time axis shows 12-hour labels, the table scrolls (about eight of its 26 rows are visible at once), and the Power BI project files are not published because they contain the Eventhouse address.
Limits and what I did not verify
- Not a continuous series. Eight gaps longer than 90 seconds, up to 487 seconds: one is the producer restart, two match producer timeouts, and five are unexplained.
- Producer timeouts. One ReadTimeout and several ConnectTimeouts calling OpenSky. The script logged each and recovered at the next interval; I did not determine the cause.
- The flag is a data check, not a safety signal. Many reported rapid descents looked inconsistent with altitude, which could be bad values, and I did not establish what actually happened.
- Mistakes I made and fixed. The first dashboard tile ignored the time-range filter, the alert condition first saved as equal to instead of less than, I first counted live-feed rows as activations, my first redaction of the dashboard export missed one identifier, and the Power BI report's 5-minute window column first loaded as text because its query had no type step. All are in the problems log.
- Not tested. The Eventstream HTTP source, ingestion latency, rebuilding the project from scratch on another machine, and a live (DirectQuery) Power BI connection to the Eventhouse.
- After the trial. The Fabric items disappear when the trial ends. The repo keeps the producer script, the KQL scripts, a sanitized dashboard export, the problems log and 22 screenshots.